
Please consider giving this project a ⭐ if you find it helpful!
Beautiful GitHub traffic analytics for all your repositories — public and private.
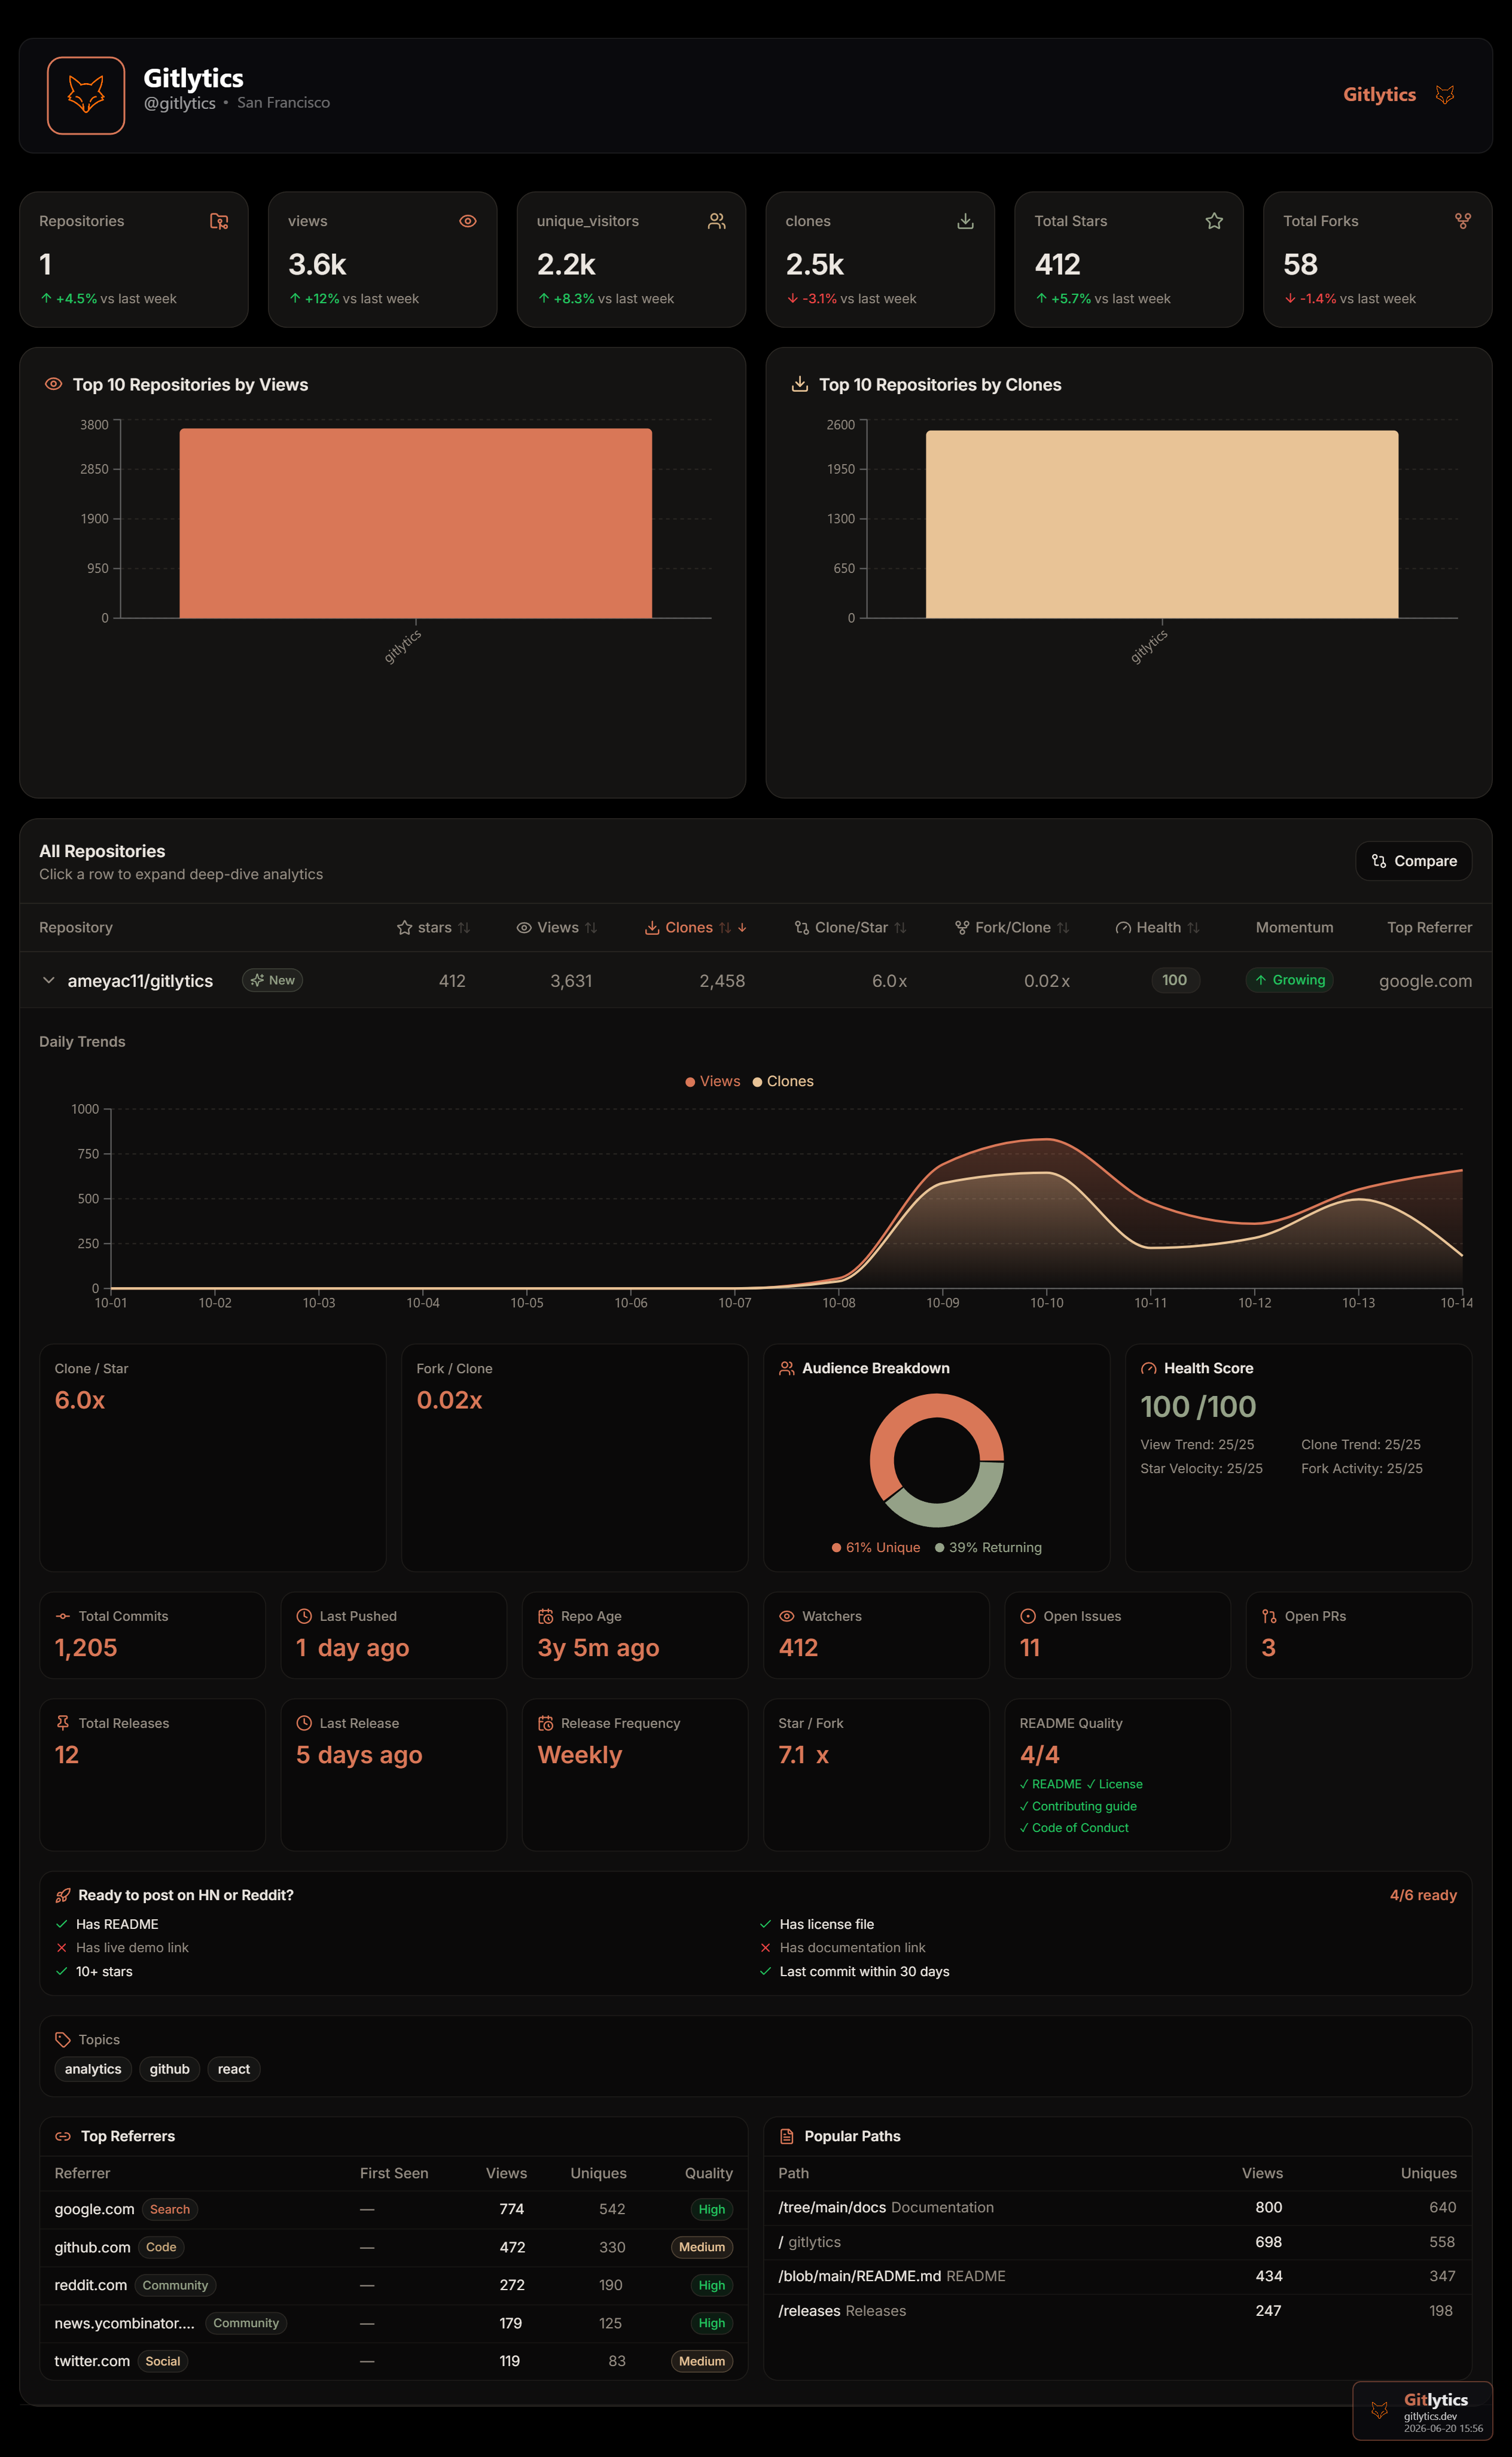
Track views, clones, referrers, and popular paths indefinitely.
✨ Try the live dashboard at dashboard.gitlytics.dev ✨
📚 Read the documentation at docs.gitlytics.dev
🐍 Native Python API
You can import Gitlytics natively into your own Python applications to fetch live repository data like views, clones, stars, and referrers. Build custom integrations, run custom cron workflows, or serve the dashboard programmatically on your own cloud servers.
- 🔗 The Gitlytics Ecosystem
- 🚨 The 14-Day Catch (And How We Fix It)
- 🛠️ Installation
- ⌨️ The 3 Core CLI Commands
- 🐍 Native Python API
- 📊 CSV Output Columns
- 🌟 Show Your Support
- 📄 License
The full Gitlytics ecosystem spans across a few repositories. If you are looking for the live web dashboard or the automation cron job, check out the links below:
- Gitlytics Web Ecosystem: The production landing page, React Dashboard, and React Documentation site.
- ⚙️ Gitlytics Automation: The GitHub Action companion tool that automates fetching and saving to defeat GitHub's 14-day traffic limit.
⚠️ Did you know? GitHub normally only saves your repository traffic data for 14 days. After two weeks, your valuable views and clones data is permanently deleted.
Don't lose your data! We built a companion automation tool that runs silently in the background every 13 days using GitHub Actions to fetch and save your data permanently.
👉 Set up GitHub Traffic Automation here (It takes literally 2 minutes to set up!)
Once you have your automated CSV data saved from that tool, you can seamlessly plug it right into gitlytics to visualize beautiful, long-term historical charts stretching back months or years!
Install via PyPI:
# Basic CLI and Python Module installation
pip install gitlytics

# Full installation (includes React Dashboard dependencies)
pip install "gitlytics[dashboard]"To use the tools, you'll need a GitHub token.
- Go to GitHub → Settings → Developer settings → Personal access tokens → Tokens (classic)
- Click Generate new token (classic)
- Select the
reposcope (required to read traffic data for private repositories) - Click Generate token and copy it!
Gitlytics is powered by 3 massive command-line tools. You can run them anywhere in your terminal.
Fetch your live 14-day traffic and print a beautiful ASCII table directly in your console.
gitlytics fetch --token ghp_your_token_here --print-table

# Fetch specific metrics only (e.g., views and clones)
gitlytics fetch --token ghp_your_token_here --print-table --metrics views clonesTired of losing data? Use sync to permanently append today's traffic to a CSV database. You can even run it as a background cron job (perfect for Raspberry Pi or Linux/Cloud servers)!
# Sync once
gitlytics sync --token ghp_your_token --data-dir ./data

# Sync specific metrics only
gitlytics sync --token ghp_your_token --data-dir ./data --metrics views clones

# Run permanently in the background as a cron job (runs at 11:00 PM every day)
gitlytics sync --token ghp_your_token --data-dir ./data --schedule-cron "0 23 * * *"Launch the beautiful React + FastAPI web interface.
gitlytics dashboard📺 Headless TV Mode: Want to display the dashboard on an office TV monitor? Pass the historical database and token directly so the UI auto-loads without requiring a manual browser login!
gitlytics dashboard --token "ghp_xxx" --data-dir "./data"
You can import Gitlytics natively into your own Python applications to build custom integrations, run custom cron workflows, or serve the dashboard programmatically on your own cloud servers.
📚 Read the Full API Documentation
Fetches the last 14 days of traffic data (views, clones, referrers, paths) for one or more repositories.
import gitlytics

# Fetch traffic for all repositories accessible by the token
df = gitlytics.fetch_traffic(
    token="ghp_your_token",
    return_format="dataframe"  # Options: "dataframe" (Pandas), "timeseries" (chart-ready dict), or "summary" (per-repo totals dict)
)

# Fetch traffic for a single specific repository and print the table to stdout
gitlytics.fetch_traffic(
    token="ghp_your_token",
    repo_name="username/my-repo",
    print_table=True
)

# Save output directly to a file (CSV or JSON depending on file extension)
gitlytics.fetch_traffic(
    token="ghp_your_token",
    return_format="dataframe",
    save_file="./data/traffic.csv"
)| Parameter | Type | Default | Description |
|---|---|---|---|
token |
str |
Required | GitHub Personal Access Token with repo scope enabled. |
repo_name |
str |
None |
Specific repository name (e.g. "user/repo"). If None, fetches all repositories. |
print_table |
bool |
False |
If True, formats and prints a detailed ASCII traffic table to the console. |
return_format |
str |
"dataframe" |
The format of returned data: "dataframe" (Pandas DataFrame), "timeseries" (chart-ready nested dict), or "summary" (per-repo totals dict). |
save_file |
str |
None |
Optional. File path where the fetched data will be saved (CSV or JSON). |
metrics |
list |
None |
Optional. List of metrics to fetch (e.g., ["views", "clones"]). |
Fetches the live traffic data and appends it to a persistent CSV database. Handles merging overlaps and duplicates. Can be scheduled with an internal cron scheduler for cloud deployments.
import gitlytics

# Standard run: Syncs current snapshots to the CSV database and exports UI JSON
gitlytics.sync(
    token="ghp_your_token",
    data_dir="./data",
    export_json="./data/export.json",
    export_public_only=True  # Security Firewall: Exclude private repos from the public-facing export.json
)

# Scheduled Cloud Worker: Run infinitely using standard cron schedule syntax
gitlytics.sync(
    token="ghp_your_token",
    data_dir="./data",
    schedule_cron="0 23 * * *",  # Runs everyday at 11:00 PM UTC
    export_json="./data/export.json"
)| Parameter | Type | Default | Description |
|---|---|---|---|
token |
str |
Required | GitHub Personal Access Token. |
repo_name |
str or list |
None |
Specific repository name(s) to sync. If None, syncs all repositories. |
data_dir |
str |
"./data" |
Directory where CSV files are saved. |
output_mode |
str |
"monthly" |
File grouping frequency: "monthly" (creates traffic_YYYY-MM.csv) or "yearly" (creates traffic_YYYY.csv). |
schedule_cron |
str |
None |
Optional cron expression (e.g., "*/15 * * * *"). If set, runs an infinite scheduler loop. |
export_json |
str |
None |
Optional. Path to compile and export a consolidated history JSON for the frontend. |
export_public_only |
bool |
True |
Security firewall: if True, strips private repository data from the compiled export_json. |
metrics |
list |
None |
Optional. List of metrics to sync (e.g., ["views", "clones"]). |
Launches the FastAPI backend and hosts the embedded React SPA dashboard.
import gitlytics

# Host the dashboard programmatically on a custom host/port
gitlytics.serve_dashboard(
    host="0.0.0.0",
    port=8080,
    token="ghp_your_token",     # Pre-authenticates the dashboard session
    data_dir="./data"           # Folder containing the historical databases
)| Parameter | Type | Default | Description |
|---|---|---|---|
host |
str |
"127.0.0.1" |
Host IP to bind the FastAPI server. Use "0.0.0.0" to listen on all interfaces. |
port |
int |
8000 |
Port to run the web server on. |
token |
str |
None |
Optional. Pre-authenticates the dashboard session to bypass the login screen. |
data_dir |
str |
None |
Optional. Path to the folder containing your synced CSV or JSON databases. |
When you sync data, the local CSV databases track 23 detailed metrics by default. If you customize the metrics using the --metrics CLI flag or metrics Python parameter, the CSV columns will dynamically include only the columns corresponding to your selection (along with the default date, repository, and is_private identification columns).
| Column | Type | Description |
|---|---|---|
date |
str |
ISO date (YYYY-MM-DD) for this day's traffic snapshot. |
repository |
str |
Full GitHub repository name (owner/repo). |
is_private |
bool |
True if repository is private, False otherwise. |
views |
int |
Total page views on this day. |
unique_visitors |
int |
Unique visitors on this day. |
clones |
int |
Total git clone operations on this day. |
unique_cloners |
int |
Unique clone clients on this day. |
stars |
int |
Current total star count snapshot. |
forks |
int |
Current total fork count snapshot. |
language |
str |
Primary programming language of the repository. |
topics |
str |
JSON array containing repository tags/topics. |
watchers_count |
int |
Total watchers of the repository. |
pushed_at |
str |
Last push ISO timestamp. |
created_at |
str |
Repository creation ISO timestamp. |
open_issues_count |
int |
Total number of open issues. |
top_referrer |
str |
Top external traffic referral source (14-day rolling window). |
top_referrer_views |
int |
Views sent by the top referrer. |
top_referrer_uniques |
int |
Uniques sent by the top referrer. |
_raw_referrers |
str |
Raw JSON array of all referral sources. |
top_path |
str |
Most visited repository file path (14-day rolling window). |
top_path_views |
int |
Views for the top path. |
top_path_uniques |
int |
Uniques for the top path. |
_raw_paths |
str |
Raw JSON array of all popular paths. |
If you find this project useful, please consider giving it a ⭐ on GitHub! It helps more people discover the tool.
Licensed under the Apache License 2.0.